Showing posts with label Trading. Show all posts

Tuesday, 31 October 2017

Position Sizing for active trader; If you don't bet you can't win


11.1 – Poker face

Last month I got an opportunity to play poker with a few good friends. I was playing poker after a gap of 6 years and I was quite excited about it. The buy in for this friendly game was Rs.1000/. For those who are not familiar with poker – it’s a card game where in your skill and luck are tested in equal measure.
So, the game started, cards were dealt, and in the very first round I bet Rs.200/- and I saw it go away, just like that. In the next round, I bet another 200, and again saw it go away. At this stage I convinced myself that I could make up my losses in the 3rd round, and with this thought I increased the bet size to 600, only to watch it go away! So for all practical purposes, I lost Rs.1000/- in a matter of 10 minutes! In the trading world, this is equivalent to blowing up your entire trading account.
I didn’t give up, after all, I’m supposed to know trading and poker draws many similarities to trading. I decided to ‘recover’ my initial loss and stay in the game longer. I bought in for another 1000 and started fresh. This time, I stayed on the table a bit longer – for a total of 15 minutes!
Clearly, it was not working for me. I had a better memory of me playing poker 6 years ago. Though not the best, at least, I would stay on the table till the game lasted and even win few hands. So what was happening this time around? I was confused and I kind of didn’t believe that this was happening to me? How could I wipe my account twice in a matter of 25 minutes?
With these confusing thoughts on my past poker skills and my current game play, I decided to buy in again for another 1000 Rupees. This was my 3rd buy in. In the trading world, this is equivalent to funding your account 3rd time over after successfully blowing it up twice.
What advice would you give someone who has blown up his account twice in the markets? – ‘get out of the markets immediately’, would perhaps be the best-suited advice right? Well, I dint pay any heed to my inner voice, gambler’s fallacy had taken over my rational thinking abilities and I bought in again for 1000 Rupees more.
For those of you who don’t know gambler’s fallacy – if you are betting on an outcome and you tend to make a long streak of losses, then at the time of quitting, your mind tells you or rather tricks you to believe that your losing streak is over and your next bet will be a winner. This is when you increase your betting size and lose a bigger chunk of money. Gamblers fallacy is one of the biggest culprits in wiping out many trading accounts clean.
Anyway, back to my poker game. This was my 3rd buying, I had already lost 2K and was betting with another 1K. I was confident I’d recover plus make some money and save myself some shame, but the boys on the table had other plans for me. They knew I was the sucker on the table and it was easy to allure me to make irrational bets. So they did and wiped me out clean over the next 7 minutes.
That was it, I called it quits and I got back more after losing 3k.
After the game, I thought through on what went wrong. The answer was very clear –
  1. I had forgotten to recognize the odds of winning with the cards that were dealt
  2. I was not ‘position sizing’ my bets – my bets were way too irrational and random
After a couple of weeks, I had another invite to the game. I had set a bad precedence of giving away easy money. This time around I had decided to position size my bets well.
I bought in for 1000 and started the game. Each time the cards were dealt – I accessed my odds fairly well and if I thought my odds were fair, I bet accordingly. In the trading world, this was equivalent to following a ‘trading system’ backed by position sizing techniques. The result of this simple systematic approach had a great impact on my game –
  1. I won few hands
  2. At the peak, I must have had about 4K of winnings
  3. I lasted throughout the game and had a lot of fun along the way
  4. Towards the end I gave up some gains but was extremely happy with the fact that few simple techniques helped me manage my game much better
Position sizing made all the difference in this game. It always does and this is the exact reason for me to narrate this story. I do not want you to speculate in the markets without understanding your odds or without position sizing your bets. If you do, you will end up making a fool out of yourself.
Poker is played for fun but when you trade, you are essentially deploying your capital for a more serious and meaningful outcome. So please do pay attention to some of the things we will discuss over the next few chapters. I’m certain it will have a positive impact in your trading career.
At this point I have to mention this – I myself learned position sizing many years ago by reading Van Tharp’s books. Van Tharp is one of the most prominent people to bring in the concept of position sizing to traders. I’d even recommend you buy some of his books to expand your knowledge on this subject.

11.2 – Gambler’s fallacy

We briefly discussed the gambler’s fallacy early on. I guess it makes sense to discuss a little more on this at the very beginning especially in the context of markets.
Take a look at this chart –
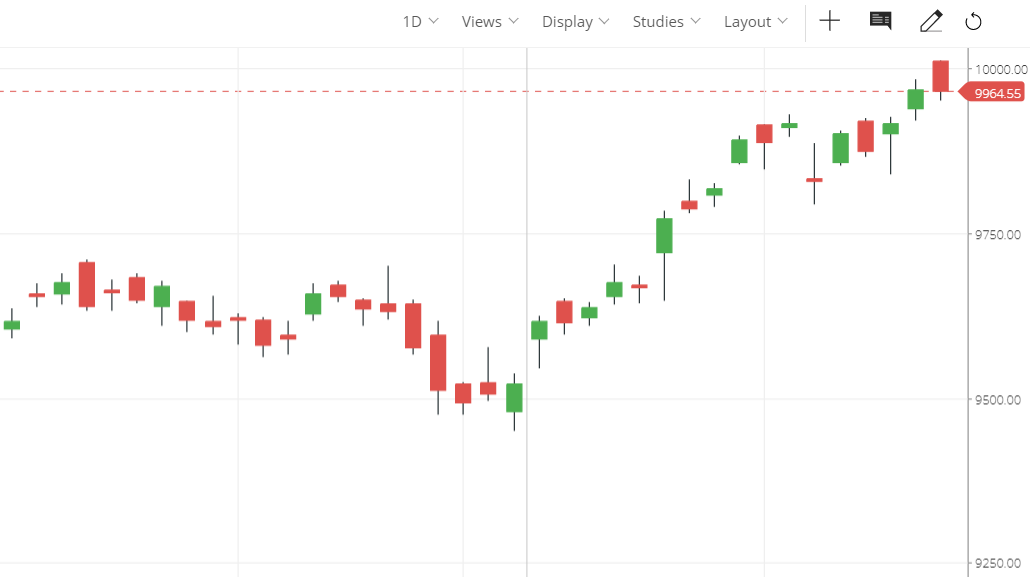
This is the chart of Nifty – Nifty hit the magical number of 10,000 on 25th July 2017. As a trader, how would you trade this?
  1. Nifty is at an all-time high – 10K
  2. Many market participants may book profits at this point – considering it is a phycological level
  3. All time high implies no resistance points
  4. Nifty has been in a great up wards trend over the past few weeks
  5. Maybe Nifty would consolidate around these levels?
  6. Maybe a correction of 2-3% before the rally continues?
Let us just assume that these are some valid points for now. This means a short position is justified or for that matter buying of puts. Your analysis could be as simple as this or as sophisticated as studying the time series data and modeling the same using advanced statistical or machine learning models.
Irrespective of what you do – there is no certainty in the markets. No one technique will tell you the outcome in advance. This implies that we are dealing with fairly random draws here. Of course, based on how meaningful your analysis is, your odds of winning can improve, but at the end of the day, there is no certainty and you have to acknowledge the fact that markets are indeed random.
Now imagine this – you have done a state of the art analysis and you place your bet on Nifty only to see the stop loss trigger. You do not give up, you place another trade and to your misfortune, you are stopped out again. This cycle repeats for say the next 4 trades.
You know your analysis is bang on – but then your stop loss is continuously getting triggered. You still have money in your account to take on bets, you are still convinced that your analysis is rock solid and the markets will turn around, you still have an appetite for risk – given all these, what do you do?
  1. Would you stop trading?
  2. Would you risk the same amount of money again?
  3. Now that you have lost 6 consecutive bets, would you consider that your odds of making money on the 7th trade is higher and therefore increase your bet size to recover your previous losses plus reap in some profits?
Which option are you likely to take? Take a minute and answer this question honestly to yourself.
Having been through this situation myself and having interacted with many traders let me tell you – most traders would take the 3rd option, the question however is – why?
Traders tend to believe that long streaks will cease when they take the ‘next’ trade. For instance, in this case, the trader has faced 6 consecutive losses, but at this point his conviction that the 7 trade will be a winner is very high. This is called ‘Gambler’s fallacy’.
In reality, when you are dealing with random draws, the odds of making a loss on the 7th trade is as high (or low) as it was when you placed your first bet. Just because you have made a series of losses, the odds of making money on the next trade does not improve.
Traders fall prey to ‘Gamblers fallacy’ and often end up increasing their bet sizes without understanding how the odds stack up. In fact, gamblers fallacy ruins your position sizing philosophy and therefore is the biggest culprit in wiping out trading accounts.
This works on the other side as well. Imagine, that you are fortunate enough to witness a 6 or let us say 10 consecutive wins. Whatever you bet on, the trade works out in your favor. You are on your 11th trade now, which of the following are you likely to do?
  1. Considering that you made enough money, would you stop trading?
  2. Would you risk the same amount again?
  3. Would you increase your bet size?
  4. Will you take a conservative approach, maybe protect you profits, and therefore reduce your bet size?
Chances are that you will take the 4th option. You clearly want to protect your profits and do not want to give back whatever you have earned in the markets and at the same time you would want to take a trade considering you have had a great winning streak.
This is again ‘gamblers fallacy’ at play. Being completely influenced by the outcome of the previous 10 trades, you are essentially reducing your position size for the 11th trade. In reality, this new trade has a same odds of winning or losing as the previous 10 bets.
Perhaps, this explains why some of the traders, even though get into profitable trading cycle end up making very little money.
The antidote for ‘Gambler’s Fallacy’, is position sizing.

11.3 – Recovery trauma

In the trading world, the capital we bring on the table is the raw material. If you do not have enough money to trade with, then how will you make a profit? Hence we need to not just protect the profits that we make, but also protect the capital.
Extending this thought – if you risk too much capital on any one trade, then you stand a chance to risk your capital to an extent that you may burn your capital leaving you with very little money. Now if you are trading with very little money, then every trade that you take will appear to be too risky. The climb back to where you started will (in terms of capital) will be a Herculean task.
I have prepared a table to help you understand this fact. Assume you have a trading capital of Rs.100,000/-. Let us see how the numbers stack up with –
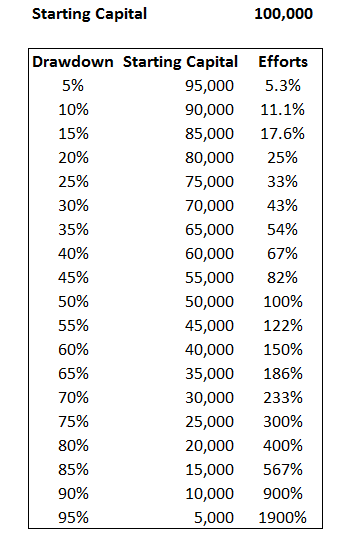
You can download the excel sheet here.
Assume you lose 5% of your capital or Rs.5000/-. Your new starting capital is Rs.95,000/-. Now, in order to recover to Rs.5000 with a capital of 95000, you need to generate a return of 5.3%, which is 0.3% more than what you lost.
Now, instead of 5%, assume you lost 10% and your capital becomes 90000, now in order to recover 10000 or 10% of your original capital, you have to earn back 11.1%. As you can see, as the loss deepens, you will have to work really hard to bounce back to original starting capital. For example at 60% loss or original capital, you are staring at a 150% bounce back.
Unfortunately, the ‘recovery trauma’ affects traders with smaller account size. Assume you come to the market with Rs.50,000/- capital. Now you would have heard of stories on how Rakesh Jhunjhunwala, grew his money from 10,000 to 15K Crores. You would want to replicate at least a small portion of this success. Honestly speaking, if you can manage to grow Rs.50,000/- to say Rs.60,000 by the end of the year, you would have done a great job. This translates to a 20% return. But this is not exciting, right? I mean earning Rs.10,000/- over 1 year when you are actively trading somehow does not seem right.
So what do you do? You tend to take bigger risks and hope to make bigger gains, and if the trade goes against you, then you are essentially falling prey to the ‘recovery trauma’ phenomena.
This is exactly the reason why you should never risk too much on any one trade, especially if you have a small capital. Remember, your odds of making good money in the markets is high if you can manage to stay in game for long, and to stay for a longer period, you need to have enough capital, and to have enough capital, you need to risk the right amount of money on each trade. This really boils down to working towards longer term ‘consistency’ in markets,  and to be consistent you need to position size your trades really well.
I’m going to close this chapter with a quote from Larry Hite.
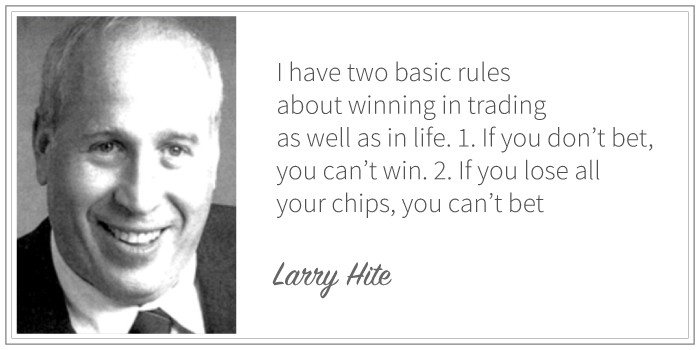
Over the next few chapter, we will dig deeper into position sizing techniques.

Key takeaways from this chapter

  1. Position sizing forms the corner stone of a trading system
  2. Gamblers fallacy is a bias highly applicable to the trading world. It makes the trader believe that a long streak of a certain outcome can break
  3. When there are infinite draws, the odds of making a profit or loss on the Nth trade is similar to the odds of making the same profit or loss on the 1st trade
  4. The recovery of capital is much more difficult task than one can imagine
  5. Traders with small accounts have a tendency to take larger bets, which they need to avoid

Zerodha 60 day challenge trade winners

10th Std Pass, Market Wizard from Thrissur

Summary

1. 10th class pass - more education seems to be a disadvantage with trading
Perhaps, lack of higher education is what made him a small player relative to other players like Rakesh Jhunjhunwala or Mankekar. He may not have the 'theoretical' background to succeed further.

2. Risk Management 
Also, from when I started, I have made sure that only a small portion (1 to 3%) of my net-worth is used for trading, I guess that is the money management rule that you are asking me for.


MAY 22, 2014CATEGORY: Winners - 60 day challenge

Traders,
After putting up the first five interviews of some of our top traders and winners of the Zerodha 60 day Challenge, I was asked many times if engineers have better odds to win at trading, as each one of the five featured until now came from a similar background. The search to break the pattern amongst our winners ended at Joby, a 10th standard pass-out from a small town in Kerala with no access to fancy tools or resources, who has still managed to be up over 300% from active F&O trading in the last couple of years trading at Zerodha. His winnings from the market runs into crores over the many years trading F&O actively. I had to use a translator as the only language he speaks is Malayalam.

Following is my interaction with Joby.
Name: Joby      Age: 47 Years
joby

Running a Bakery to Trading full time. How did that happen?
I was running my own Bakery in the early 1990′s and had people visiting the shop regularly after trading at the Cochin Stock Exchange. The bug bit me and without any knowledge of capital markets, I quit my bakery business to become a full time equity trader. Until 2000, my trading was only in equities and I started trading F&O when it was introduced in 2001. I am thankful to God that the risk I took by shutting down my bakery worked out well for me.

How much money did you start off with?
It all started with just around Rs 500 back when I started and today whatever I have made is all out of that Rs 500. Over a period of 22 years, I have also taken profits out of trading and invested into other avenues, and that trade also has worked out very well.

Investment into other avenues? Why not into stocks?
I have always traded the markets, but all my investments till date have never been in stocks. I guess the reason for this is because it is very tough to trade and invest at the same time, I was never comfortable doing that.  For example, I am shorting Nifty futures because I am feeling bearish, but what do I do with the stocks that I am holding for long term–hold or sell? It is very easy to say that you will hold for long term, but such scenarios where there is indecision or time taken can be detrimental to the outcome of your trade.

What do you trade on, mostly? Are they intraday or positional?
I have mostly been trading options from when it was introduced on NSE in 2000, and almost all of it shorting/writing options. I usually hold the positions overnight and sometimes take intraday trades as well.

Why mostly option writing?
I feel options give higher flexibility and shorting options inherently improves the winning odds as long as you have a risk management policy to cover when you are wrong, as the losses writing options can be unlimited. The opportunity to profit from  trading options prior to 2010 was much higher.

What is your risk management policy/money management rule?
I haven’t ever had any big losses from the time I started trading and you will be surprised to know that I don’t really have a risk management policy as such. I don’t have fixed stop losses, I average my position when in loss, I go against the trend, break many rules that a lot of analysts keep shouting out on TV asking to follow. One of those things I do though is that when I take a wrong trade that was not intended to, I immediately book the loss if any and try to stay away from trading on that particular day.

Also, from when I started, I have made sure that only a small portion (1 to 3%) of my net-worth is used for trading, I guess that is the money management rule that you are asking me for.

So what about the trading strategy, how do you enter or exit?
It is based on support and resistance, I wait with a lot  of patience for market to show a range and when it displays the same, I start writing options which will benefit if the market stays within the range. Most of these trades typically are hedged because I would be shorting calls and puts at the same time so that I can benefit from both the calls and puts premium losing its value when in the range. From the time India VIX  was launched in 2009, I also keep a tab on it to decide how aggressive I should be writing options, the best times being when value of VIX is relatively higher.
When convinced that the range is getting broken,  I will start taking single sided trades either long or short and these could sometimes be plain long options or buying/selling futures. I also as a rule completely avoid writing naked put options.

How do you determine this support and resistance in charts?
I don’ t follow any technical analysis or look at any charts. To be very honest I don’t even know how to use computers properly. But all the years I have been trading actively, I have spent countless hours looking at the terminal on how Nifty prices move. If the market is trading, I am looking at the screen if I am in a trade or not. I have my own unique way of calculating the resistance and support just by watching and analyzing the price and volume. I don’t need to look at the chart for this, just a market depth window (Snap quote window) is enough.

Do you know that what you are saying sounds like “Tape Reading or Reading the Tape“?
As I said earlier, have studied only till 10th, don’t browse the internet, have never followed tips, don’t believe in stop losses, I am able to look at the symptoms of Nifty and predict if it will be in a range or breakout.

No stop loss? So how do you exit when in profits or losses?
It is based on how I feel about my trade with respect to how the markets are moving. I don’t really have preset exit points and there have been many times where I have averaged when the price has gone against my trade. I will book a loss or profit based on my conviction of the trade.

What do you do when not trading?
My routine is working out in the morning, playing football and going on family vacations with my wife Seena and two kids once or twice every year.

It is a special achievement to be up so much trading actively on F&O, any plans to scale up in the future?
I  love what I am doing presently which is trading but not very aggressively, and wish to continue the same. Also before we end the conversation, I want to thank Zerodha for putting up a very unique initiative like the 60 Day Challenge that gives additional motivation to profit and be amongst the winners.
____________________________________________________________
I quizzed Joby for quite a while trying to figure out on how he determines the range, support and resistance and if there was any method to it. I was also astonished that he remembered the exact expiry settlement prices for almost the last 10 years. I could only conclude that he has a special skillset and importantly also the discipline to go along with it. For all the naysayers of “Tape Reading”, Joby proves it can be done and I think a critical element to his success is also the fact that only a small portion of his networth is used for trading, that in itself is his risk/money management rule.
Wishing Joby all the best,
If you haven’t taken up the 60 day challenge yet, visit here to know more and get started.

Nithin Kamath
Founder & CEO @ Zerodha, team working towards breaking all barriers that I personally faced as a retail trader for over a decade. Love playing poker, basketball, and guitar. Getting body fat % in single digit is the next personal endeavor :) .

https://zerodha.com/z-connect/zerodha-60-day-challenge/winners/10th-std-pass-market-wizard-from-thrissur

Monday, 9 October 2017

What sort of asset regularly goes through massive price swings?

The Biggest Key (By Far) to Making Huge Money in Resource Stocks

    23 SHARES
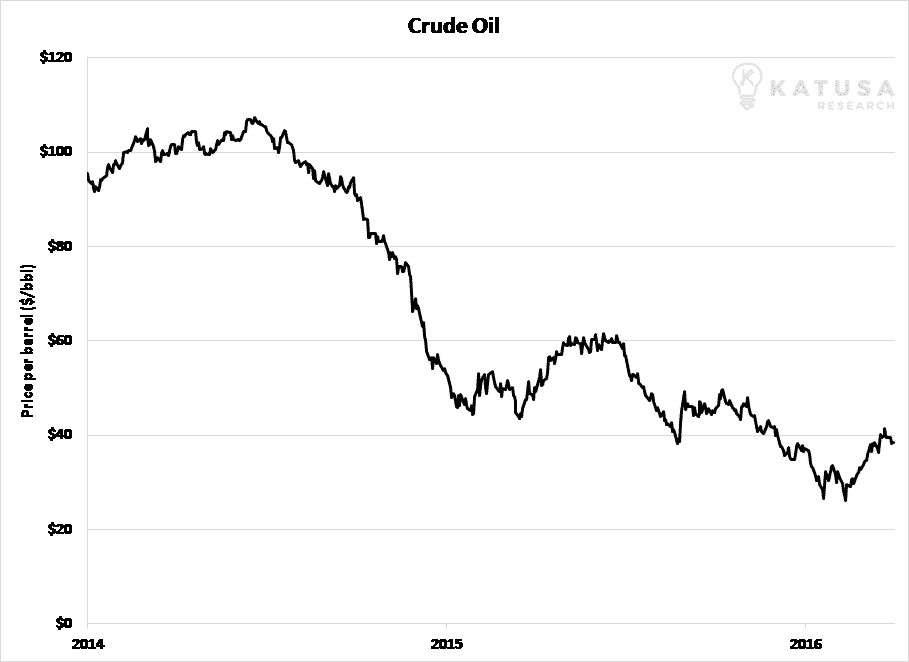
On June 18, 2014, the price of crude oil traded for $106 a barrel.
Just 19 months later, the price had plummeted 73% to $28 per barrel.
After reaching $28 per barrel, oil then skyrocketed 88% in just four months.
What sort of asset regularly goes through massive price swings like that?
Not your house…and not government bonds.
Natural resources do.
More than any other asset, natural resource prices go through extraordinary booms and busts. One year, the value of a resource like oil, silver, or copper will skyrocket 75%. The next year, it will fall 50%.
Because natural resources cycle through huge booms and busts, they are said to be “cyclical” assets.
Many things in our world move in cycles. The weather moves in cycles. The planets revolve around the sun in cycles. Animals move around their habitats in cycles.
You also see cycles in the financial markets…especially in the natural resource sector.
Because resources cycle through booms and busts, they are said to be “cyclical” assets. Understanding this concept is by far the biggest key to making huge returns in the natural resource sector.
If you don’t understand how resource cyclicality works, nothing else you do will matter. It’s the most important thing.
The cyclicality of natural resources contrasts with “noncyclical” businesses like those that sell toothpaste, toilet paper, or food.
Demand for everyday things like these is relatively constant. No matter what is happening with the economy, you’re probably going to brush your teeth, go to the bathroom, and eat lunch.
Natural resources, however, exhibit extreme cyclicality. And their massive price moves produce massive opportunities to profit.
In the year 2000, for example, shares in the world’s largest uranium mining company, Cameco, traded for $1.35 per share. Seven years later, Cameco shares had increased in value by 3,600%, reaching $50 per share.
Gains like that are possible in natural resources because of their unique supply/demand dynamics…
When the price of a natural resource soars, it encourages lots of new production. Natural resource producers always want to cash in on high prices.
For example, if corn soars in price, farmers will plant a lot more corn.
If the price of oil soars, oil companies will pump a lot more oil.
This natural response to high prices leads to an increase in the supply of the natural resource.
The soaring price also encourages consumers of that resource to find cheaper replacements. For example, if gasoline were to triple in price, you would be more likely to take the bus or cut back on car trips. If the price of coffee soars, you might start drinking tea instead.
This natural response to high prices leads to a decrease in demand for the natural resource.
When the supply of a natural resource increases and demand for it decreases, you get much lower prices. You get a bust. In other words, a resource bull market eventually sows the seeds of its own destruction.
When a boom ends, it’s not unusual to see the value of a natural resource plummet in a short amount of time. Remember, the price of oil plummeted 73% in less than two years.
300616 Crude Oil
A natural resource boom is the mirror image.
When the price of a natural resource is very low, it discourages production.
After all, why ramp up production if the price is in the toilet?
The farmers who planted as much corn as they could when prices were sky high will plant a lot less corn if prices are low.
The oil companies that produced as much oil as they could when prices were high will produce less if prices are low.
Low prices also encourage consumption. You’re probably going to drive more if the price of gasoline plummets.
When the supply of a natural resource shrinks and demand climbs, you get a boom. In other words, a resource bear market eventually sows the seeds of its own destruction.
Recent history in the copper market provides a great example of this.
During the 1990s, the price of copper was very low. This led to decreased production. Meanwhile, demand for the cheap resource soared.
This “increased demand/decreased supply” sandwich caused the price of copper to soar from $0.75 per pound in 2003 to $4 per pound in 2008 (a 400%+ gain).
When a natural resource moves in price, the share price movements of natural resource producers are amplified. During the big 2003 – 2007 copper rally, the large copper miner Freeport-McMoRan skyrocketed from $3.50 per share to over $50 per share during this time–a 1,300%+ increase.
300616 Freeport-McMoRan Chart
By now, you surely see what we need to do as resource investors.
***We need to invest in individual resource markets when prices are very cheap and depressed, yet poised to climb.
This setup led to the 1,300% gain in Freeport McMoRan…and the 3,600% return in Cameco.
To make huge gains in natural resources, we have to buy assets after bear markets…when they are very cheap and depressed.
In these situations, you’ll be buying something the investment crowd doesn’t want. But that’s a sign you’re probably doing the right thing.
When the crowd finally realizes a boom after it has already started, it will bid the price of your assets up to incredible heights. That’s when you–the contrarian–can sell for huge profits.
Resource markets are extremely cyclical.
Their enormous booms and busts make it tough for most people to make money in them.
But extreme resource cyclicality offers huge opportunity to those of us who understand it.
Regards,

Marin Katusa

As s a professional investor, I love volatility. I owe much of my success to this “dirty word” of the financial world

Asymmetry: The Financial Secret That Can Earn You 10,000% Returns (No Joke)

    18 SHARES
Asymmetry
Asymmetry: The Financial Secret That Can Earn You 10,000% Returns (No Joke)
Did you see The Big Short yet?
A movie based on Michael Lewis’ hit book of the same name, The Big Short was released in late 2015.
It’s the story of how a small, clever group of people saw the 2008 mortgage crisis coming. Initially, these people and their warnings were mocked. Eventually, they were vindicated… and made billions of dollars by betting correctly on the outcome.
People loved The Big Short. It was nominated for five Academy Awards, including Best Picture. Critics praised the movie for explaining complicated financial concepts in such a way that layman moviegoers could understand them.
If you haven’t seen the movie, it’s worth watching. It’s both educational and entertaining. But as good as The Big Short is, it failed to teach the story’s greatest, most useful lesson. It failed to share one of the world’s most powerful financial strategies.
I’d guess maybe one investor in a 1,000 knows this strategy… and less than one in 100,000 knows how to use it properly. But it’s how the traders who inspired The Big Short turned relatively small amounts of money into millions – even billions – of dollars during the housing collapse. They made returns in excess of 10,000% (a gain that turns $10,000 into more than $1 million).
One trader, John Paulson, used this strategy to make over $10 billion for himself and his clients, one of the biggest scores in market history.
As powerful as this strategy is, you almost never see it discussed in the mainstream press. You almost never see it mentioned on financial television. But those who understand its power use it to generate incredible wealth.
This secret is known as “the asymmetric bet.”
In this letter, I’ll explain how it works… and how you can use it for your personal benefit.
The Power of Asymmetry
You probably learned about symmetry in school.
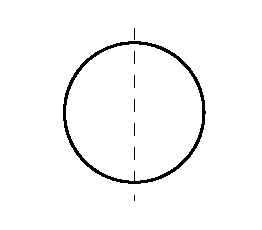
It’s when the parts of something have equal form and size.
For example, cut a circle in half, and the two parts are symmetrical.circle
In many cases, symmetry is attractive. Generally speaking, the more symmetrical someone’s face is, the more attractive they are considered to be. Symmetry can be attractive in architecture, art, and landscaping.
But when it comes to the financial markets, expert operators avoid symmetry.
Symmetry is for chumps.
Expert investors and speculators hunt for asymmetry.
An asymmetric bet, trade, or investment is when the potential upside of a position is much greater than its potential downside.
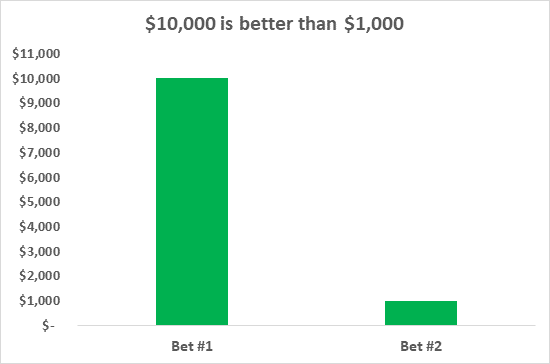
If you risk $1,000 for the chance of making $10,000, you make an asymmetrical bet.
If you risk $1,000 for the chance of making $1,000, you make a symmetrical bet.
Which one is more attractive to you?
You’re probably thinking the chance to make $10,000 is better than the chance to make $1,000. That’s good. That’s the right answer.
Asymetric bets
Even though this idea is simple common sense, most people fall into the trap of making symmetrical bets in the stock market.
Many investors commonly risk 100% of their money in the pursuit of a 100% return. Or even worse, they risk 100% of their money in the pursuit of a 50% return.
For example, an investor will buy a stock that some expert touts as having “100% upside,” and he’ll be willing to ride the stock to zero (a 100% loss) if things don’t work out.
100% upside.
100% downside.
Symmetry.
This kind of symmetry offers you horrible odds… the odds you’ll find in casinos and most sports betting. Most people don’t understand this concept, and it kills them in the financial markets.
Again, symmetry is for chumps.
I won’t touch an investment with a symmetrical risk/reward profile. When I put my money to work, I look for opportunities where I can risk $1 in the pursuit of $20 or even $100 in returns.
Risk a little. Make a lot.
That’s the idea behind asymmetric bets.
Where to Find Asymmetric Bets
As I mentioned, the guy who risks 100% of his capital to make a 100% return is making a bad, symmetric bet.
So who is making asymmetric bets? And how do you find those bets?
Asymmetric bets come in a variety of forms…
If you buy a stock with 500% upside potential and you’re prepared to cut your losses at 50% of your investment, that’s an asymmetric bet.
Upside of 500%.
Downside of 50%.
10 to 1 odds.
Stocks with the potential to massively appreciate in value offer asymmetric risk/reward profiles. This is a big reason I devote my time and energy to natural resource investing.
The natural resource sector is one of the financial market’s most volatile sectors. More so than other assets, commodity prices move up and down in huge boom and bust cycles. They exhibit what’s called “extreme cyclicality.” One year, the price of a commodity like oil, silver, or copper can skyrocket 75%. The next year, it can fall 50%. (Read this essay for the full explanation.)
This volatility gives life to many 500%+ stock market winners every year. The key is to buy assets after busts and before booms, not the other way around.
As I’ve written before, most investors think “volatility” is bad word. You don’t want to see it in your prudent, conservative investment mix. The talking heads on financial television bemoan volatility. Mainstream headlines make it sound like a terrible thing.
As s a professional investor, I love volatility. I owe much of my success to this “dirty word” of the financial world. I believe it’s a landmark moment in an investor’s career when he or she realizes that volatility can be harnessed, directed, and used like a tool to create wealth quickly.
If you know how to harness volatility, the natural resource sector can be a constant source of high-quality, asymmetric bets that build wealth for you. You can make returns in 10 months that take most people 10 years to make.
If you focus on making the kinds of asymmetric bets that are common in the resource market, I can’t guarantee you’ll make billions like the guys who inspired The Big Short. But I can guarantee you will dramatically improve your investment results.
Regards,
Marin

Zweig said trying to buy an asset in freefall is like trying to catch a falling safe. It’s a much better idea to wait for the safe to hit bottom and for its contents to explode onto the sidewalk.

This Single Idea is Worth At Least $100,000

OCTOBER 6, 2017
When an object begins falling from high up in the sky, it accelerates downward – falling faster and faster and faster – until a fascinating thing happens.
As the object falls, it collides with air molecules. These tiny collisions exert upward force on the object. This is called “air resistance.” The faster an object falls, the greater the impact of the collisions with air molecules, and the greater the air resistance.
Eventually, the air resistance becomes so great that it balances out the force of Earth’s gravitational pull, and the object can fall no faster.
This maximum speed is called “terminal velocity.”
Although stock and commodity prices aren’t physical objects, during a bear market, it can seem like they’re falling at terminal velocity. Your position in the market has a huge influence on how it feels to you. If your position is an owner instead of an observer, it can feel much faster.
As crisis-hunting alligator investors lying in ambush along the world’s financial river, we like to see asset prices falling at terminal velocity. When an asset plummets in value or suffers a bear market, it immediately goes on our watch list. As I often state, markets are rational most of the time. They price most assets correctly most of the time. But when emotion levels go off the charts – like they do in a crash or a bear market – emotion overwhelms reason.
During a crash, terrified investors sell assets with no regard for their underlying values or ability to produce cash flow. During a crash, the price of assets becomes “decoupled” from the value of assets. If you can keep a level head while others are losing theirs, you can buy at fire-sale prices.
For example, during the 2008-2009 financial crisis, the share price of Canada’s largest diversified miner, Teck Resources, plummeted from over $50 per share to under $4. It then soared back to $50 per share and beyond within 18 months (a gain of more than 1,100%).
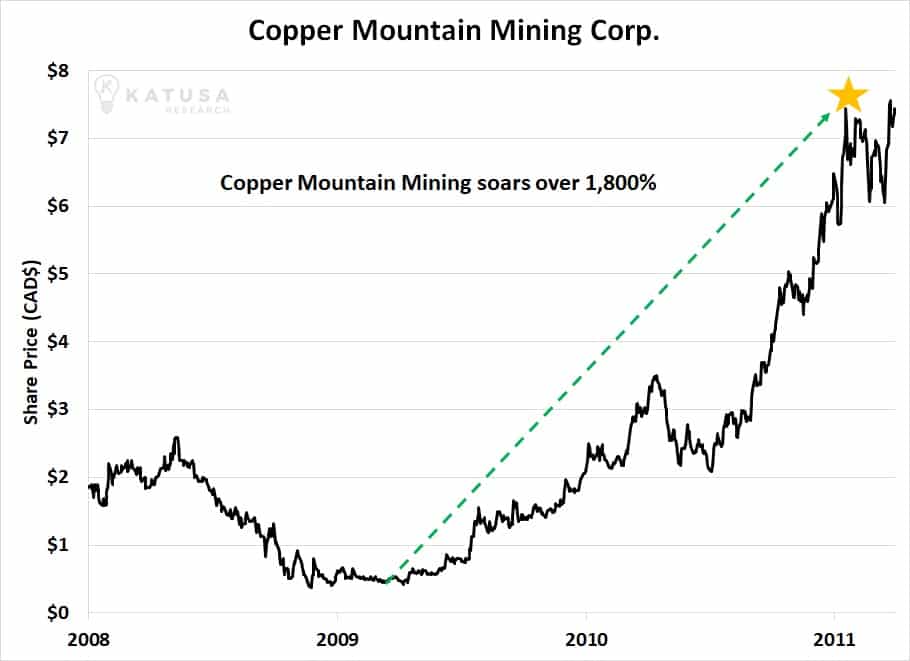
Or look at what happened to Copper Mountain Mining. It’s one of the largest copper producers in Canada (I have been on its board for over a decade). The company had a successful IPO in May 2007, but fell from over $2 a share to below $0.40 per share during the financial crisis. By 2011, the crisis was over, and the stock climbed over $7 per share. I personally made over 1,800% on that move.  I’m very excited about Copper Mountain’s future.
Long-time readers know “crisis hunting” is one of the pillars of our market approach. We run towards crisis and against panicking crowds. It’s a lonely job, but the rewards for doing so are simply incredible.
There’s a good reason legendary billionaire investor Warren Buffett says one of the secrets of investing success is to “be greedy when others are fearful.” There’s a good reason a quote attributed to the legendary financier Nathaniel Rothschild is “buy when there is blood in the streets.”
The Lesson of the Falling Safe
Markets in freefall are often called “falling knives” or “falling safes.” In other words, trying to catch them can be extremely dangerous.
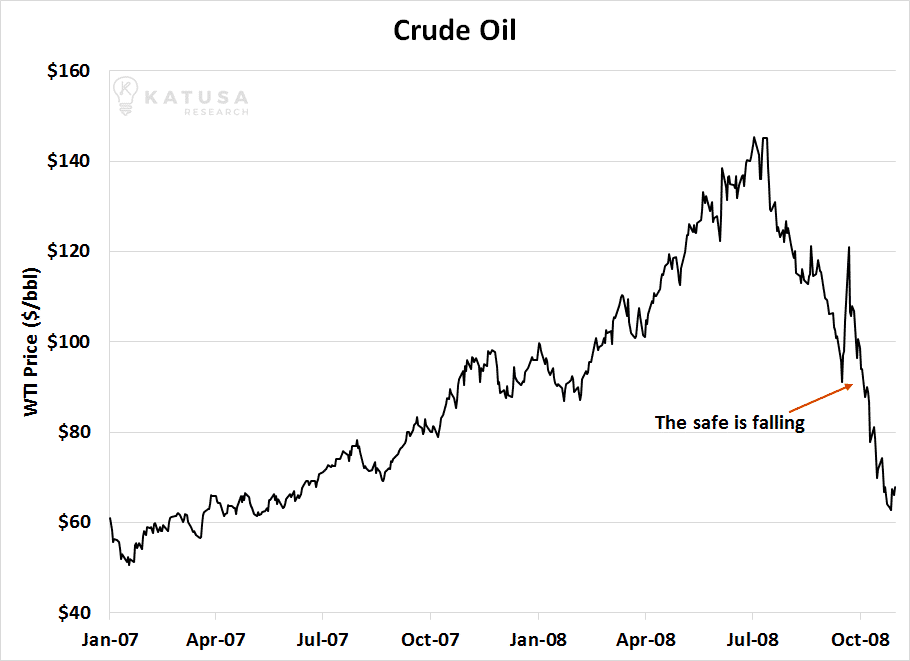
For example, below is a chart of crude oil prices from early 2007 through late 2008. See that sharp decline on the right-hand side? That’s a market in freefall. It’s a falling safe.
A market in that state is nearly impossible to “time” successfully. It’s nearly impossible to buy at the bottom. But that doesn’t stop many people from trying to do so. Many people see a decline like this and think, “It’s due for a big rebound… so I’m buying.”
Some people get a thrill from trying to pick the exact bottom of a market in freefall. They go for the glory and start buying… and often suffer huge losses as the market keeps falling.
Here’s what many people fail to realize: A massive decline like the 2008 oil crash introduces a lot of emotion in the marketplace. It catches most people off-guard. It produces big swings in their account values (usually to the downside). They begin to panic.
The very high levels of emotion create markets that wildly move up and down with very little concern for fundamentals. During these times, it doesn’t matter if an asset is overvalued or undervalued. People go crazy. Trying to time market movements – trying to catch a falling safe – can be very risky.
There’s a much lower-risk way to play markets in crisis. Knowing how to do it will give you a huge edge over others. It can be summed up simply as:
Don’t try to catch a falling safe; wait for it to hit the sidewalk, then walk over and pick up the money.
The legendary trader and market analyst Marty Zweig (who once owned one of New York City’s most expensive penthouses) is one of history’s biggest advocates of this strategy.
Zweig said trying to buy an asset in freefall is like trying to catch a falling safe. You’re likely to get crushed by it. It’s a much better idea to wait for the safe to hit bottom and for its contents to explode onto the sidewalk.
Look at the 2008 crude oil market again. Instead of trying to catch the falling safe by going long when the chart looked like this…
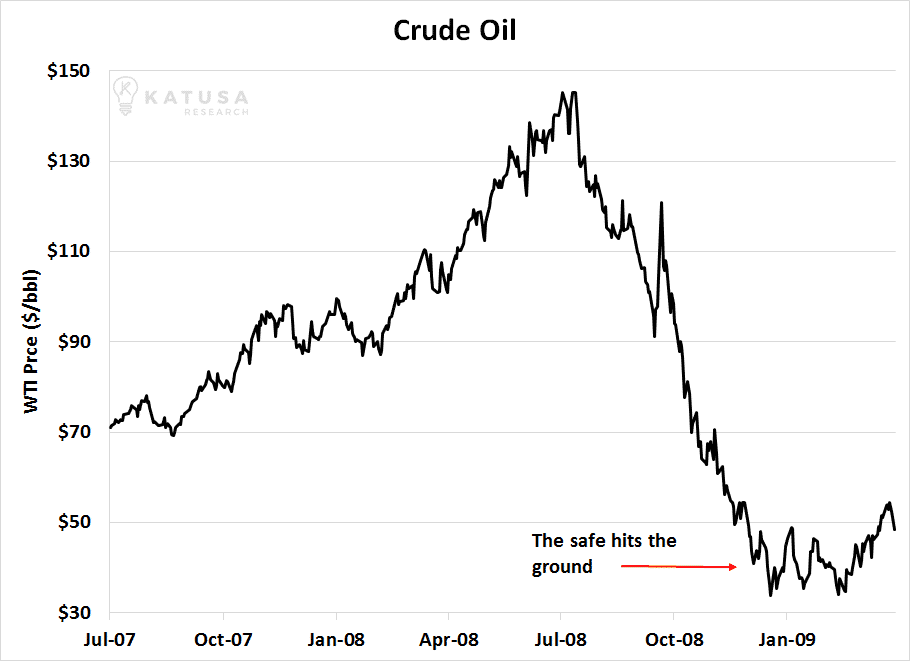
… the smart speculator waits for the safe to hit the ground. He waits for the chart to look like this…
Look at the price action during late 2008. People who bought oil at $70 in October 2008 got a 50% “discount” from July’s high of $140. They also lost half their money as the safe kept falling. It eventually hit the ground at $35 in December.
The safest, best time to buy oil and oil stocks came in early/mid-2009. The falling safe had hit the sidewalk. After hitting a low of $35 a barrel in December, oil rebounded into the upper $40 range. The oil bears countered this rally and tried to drive prices back down to the low several times. Each time, oil refused to decline. Oil “tested” its bottom. There was no one left to sell.
It was much safer to buy oil and oil stocks in early-to-mid 2009 than it was in 2008. People who waited for the safe to hit the ground made huge returns as oil went on to rally into the $70s and $80s in 2009. They waited for the high levels of emotion (and risk) to get wrung out of the market.
This strategy of not buying markets in freefall – and instead, waiting for the falling safe to hit the ground – will put you miles ahead of your fellow investors. It will allow you to consistently make huge returns in the stock and commodity markets.
Keeping our “alligator” approach in mind is crucial right now because I believe we could yet see a crisis in gold companies with development-stage assets. The sector is starting to experience serious stress and serious selling pressure.
Development-Stage Gold Assets Are Getting Very Cheap
If you follow the gold market at all, you know gold stocks performed horribly from 2011 to 2016. It was a bear market that crushed retail and institutional investors alike. Most gold company shareholders felt like they spent years riding on falling safes.
I believe this bear market has made mid-tier gold companies with development-stage projects very cheap. “Development-stage” gold companies have proven assets in the ground and are in the process of building mines. They aren’t drill hole plays and they aren’t yet producing gold.
In addition to suffering from the overall bear market, the gold ETF rebalancing we wrote about here, gold development firms have performed poorly because of investor fatigue.
Over the last decade, a large majority of the development stage companies have disappointed their investors with cost overruns, production delays, production problems (higher cost of production and lower production levels), and too much debt. Their business performance has been pathetic.
A critical step in getting a gold project into production is something called a Bankable Feasibility Study (BFS). A BFS should be a comprehensive study of a project’s potential economics. It takes into account aspects like geology, metallurgy, infrastructure, and environmental impact. Bankable Feasibility Studies are required for miners to get financing from banks.
In many cases, the Bankable Feasibility Studies (BFS) gold developers touted over the past decade turned out to be nothing more than Bankable-Fiction Stories used to finance the projects that ultimately disappointed shareholders and destroyed shareholder value.
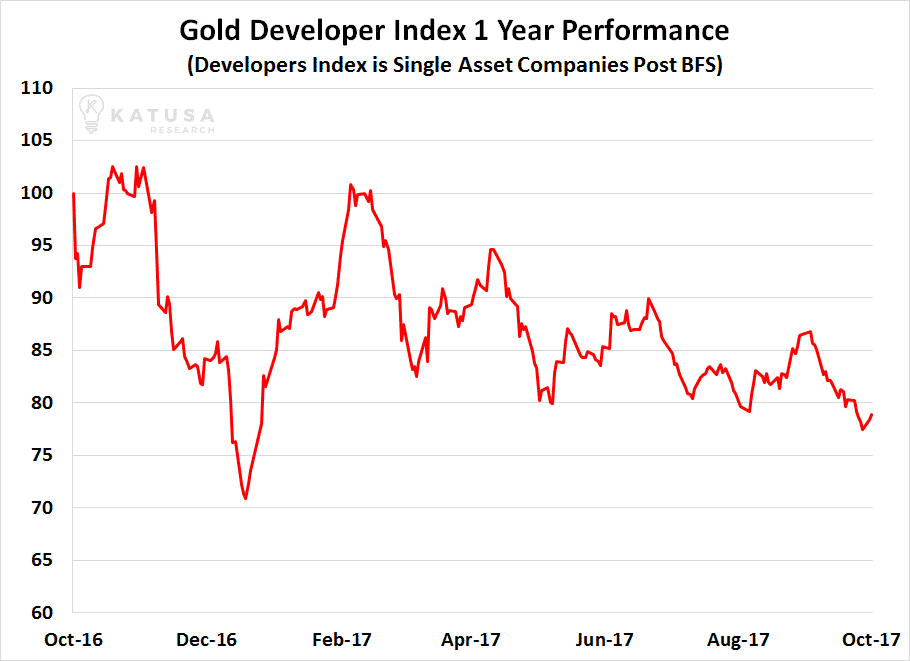
To track this sector, I’ve built a custom stock index, the Katusa Gold Developer Index. It is made up of 15 publicly-listed companies that have completed a BFS on their gold projects and are currently working towards gold production. As you can see from the chart below, this “falling safe” slammed the pavement in late 2016… but has traded in a sideway range since then.
I believe this situation has created some large potential opportunities.
Let me explain.
The management teams who have survived the gold bear market have not forgotten which engineering firms, engineers, and geologists produced the bad Bankable Feasibility Studies. Engineering firms are hired as independent third-party consultants. The engineering firm’s professionals (the geologists, engineers, etc) sign off on the studies. In theory, they should not be “managed or controlled” by the companies that hire them. Also, in every BFS, the individuals who have signed off must publish their professional credentials.
Before I jump into the details of a BFS, I first investigate the track record and credentials of the geologists and engineers who signed off on the BFS. I look at their last dozen studies.
I won’t get into specific names, but there are individuals who have signed off on multiple studies that were absolute disasters. Why bother giving that individual or firm another chance? 
Not with my money.
Gold development companies have paid very close attention to these failures as well. Because there are so few mines currently being built, the management teams for the first time in many years can select the best engineering firms using the best geologists and engineers available at reasonable prices, because we are not in a gold bull market. The engineering firms need work and are pitching their best professionals to potential clients. But the market hasn’t figured this out yet.  We have.
Another drawback for the development-stage companies is their lack of news flow. There are no sexy drill hole results or near-term catalysts other than completing construction, which in most cases is at least 12 months away.
The combination of previous disappointments from the sector, investor fatigue, lack of news flow, and selling by large gold ETFs has created a sector that is fundamentally cheap and trading at valuations much lower than exploration companies with no 43-101 resource reports, BFS or funding to build mines. 
So why should you care?
The larger companies are taking note and paying attention. Consolidation in the mid-tier gold sector is going to happen. The odds of an exploration target ever becoming a mine is lower than 1 in 3,000. Ironically, many of the near-term gold producers are trading today at market capitalizations lower than many exploration companies with nothing more than “potential” and a lot of risk. In some cases, the exploration companies are trading in the $200 million to $1 billion valuation without a single drill hole result!
And with consolidation comes takeouts at premium prices. Once a few takeouts happen, the other gold developers will start trading higher because the market will realize what the new trend in the gold space is, and you will make a fortune.
Why take on the 1 to 3,000 odds, when the companies that have already defeated those odds are trading at valuations lower than their high-risk peers? This is a unique opportunity I’m personally betting big on.
The gold development sector It is the absolute best place in the gold sector for value investors to place their bets.
All the above will happen whether gold prices go higher or not. I believe gold prices are going higher, and that will greatly benefit the gold developers in getting even higher takeout prices.
Safes have been raining in the gold sector. But they’ve hit bottom and are now very cheap.  It’s one of the biggest resource opportunities of the next 24 months.
Regards,
Mari

https://katusaresearch.com/single-idea-worth-least-100000/?curator=alphaideas&utm_source=alphaideas