This Single Idea is Worth At Least $100,000
OCTOBER 6, 2017
When an object begins falling from high up in the sky, it accelerates downward – falling faster and faster and faster – until a fascinating thing happens.
As the object falls, it collides with air molecules. These tiny collisions exert upward force on the object. This is called “air resistance.” The faster an object falls, the greater the impact of the collisions with air molecules, and the greater the air resistance.
Eventually, the air resistance becomes so great that it balances out the force of Earth’s gravitational pull, and the object can fall no faster.
This maximum speed is called “terminal velocity.”
Although stock and commodity prices aren’t physical objects, during a bear market, it can seem like they’re falling at terminal velocity. Your position in the market has a huge influence on how it feels to you. If your position is an owner instead of an observer, it can feel much faster.
As crisis-hunting
alligator investors lying in ambush along the world’s financial river, we like to see asset prices falling at terminal velocity. When an asset plummets in value or suffers a bear market, it immediately goes on our watch list. As I often state, markets are rational most of the time. They price most assets correctly most of the time. But when emotion levels go off the charts – like they do in a crash or a bear market – emotion overwhelms reason.
During a crash, terrified investors sell assets with no regard for their underlying values or ability to produce cash flow. During a crash, the price of assets becomes “decoupled” from the value of assets. If you can keep a level head while others are losing theirs, you can buy at fire-sale prices.
For example, during the 2008-2009 financial crisis, the share price of Canada’s largest diversified miner, Teck Resources, plummeted from over $50 per share to under $4. It then soared back to $50 per share and beyond within 18 months (a gain of more than 1,100%).
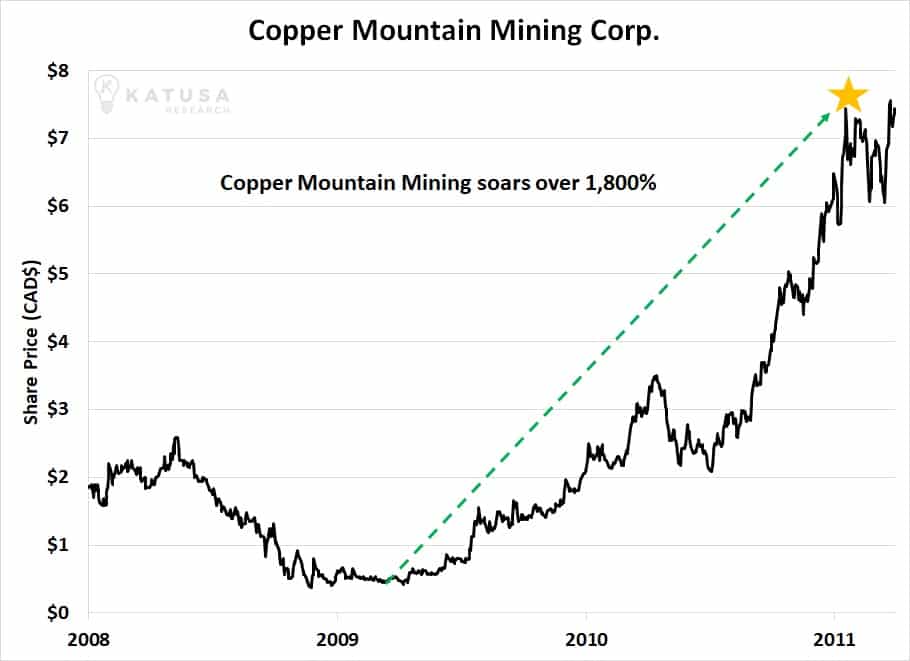
Or look at what happened to Copper Mountain Mining. It’s one of the largest copper producers in Canada (I have been on its board for over a decade). The company had a successful IPO in May 2007, but fell from over $2 a share to below $0.40 per share during the financial crisis. By 2011, the crisis was over, and the stock climbed over $7 per share. I personally made over 1,800% on that move. I’m very excited about Copper Mountain’s future.
Long-time readers know “crisis hunting” is one of the pillars of our market approach. We run towards crisis and against panicking crowds. It’s a lonely job, but the rewards for doing so are simply incredible.
There’s a good reason legendary billionaire investor Warren Buffett says one of the secrets of investing success is to “be greedy when others are fearful.” There’s a good reason a quote attributed to the legendary financier Nathaniel Rothschild is “buy when there is blood in the streets.”
The Lesson of the Falling Safe
Markets in freefall are often called “falling knives” or “falling safes.” In other words, trying to catch them can be extremely dangerous.
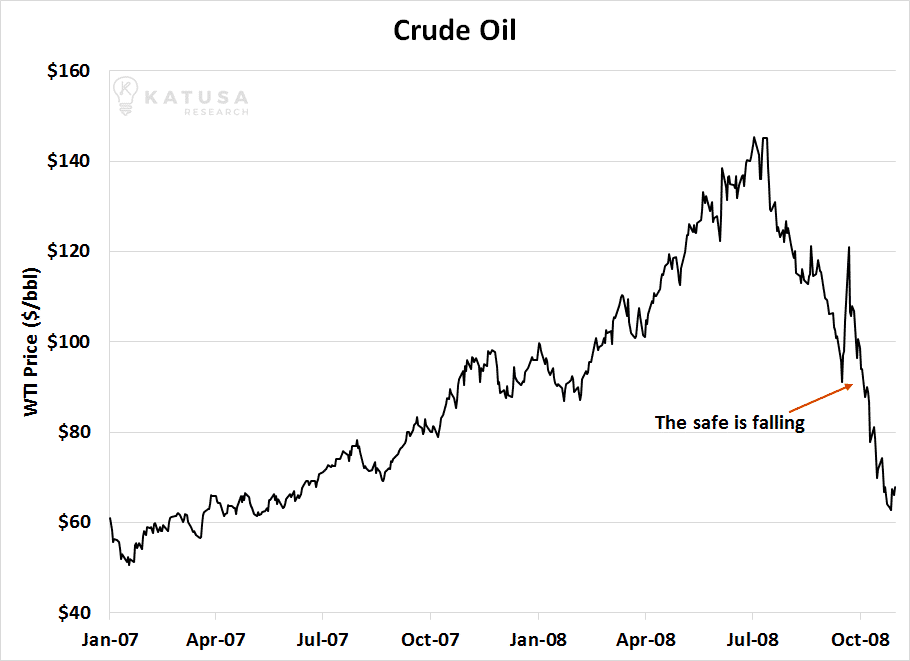
For example, below is a chart of crude oil prices from early 2007 through late 2008. See that sharp decline on the right-hand side? That’s a market in freefall. It’s a falling safe.
A market in that state is nearly impossible to “time” successfully. It’s nearly impossible to buy at the bottom. But that doesn’t stop many people from trying to do so. Many people see a decline like this and think, “It’s due for a big rebound… so I’m buying.”
Some people get a thrill from trying to pick the exact bottom of a market in freefall. They go for the glory and start buying… and often suffer huge losses as the market keeps falling.
Here’s what many people fail to realize: A massive decline like the 2008 oil crash introduces a lot of emotion in the marketplace. It catches most people off-guard. It produces big swings in their account values (usually to the downside). They begin to panic.
The very high levels of emotion create markets that wildly move up and down with very little concern for fundamentals. During these times, it doesn’t matter if an asset is overvalued or undervalued. People go crazy. Trying to time market movements – trying to catch a falling safe – can be very risky.
There’s a much lower-risk way to play markets in crisis. Knowing how to do it will give you a huge edge over others. It can be summed up simply as:
Don’t try to catch a falling safe; wait for it to hit the sidewalk, then walk over and pick up the money.
The legendary trader and market analyst Marty Zweig (who once owned one of New York City’s most expensive penthouses) is one of history’s biggest advocates of this strategy.
Zweig said trying to buy an asset in freefall is like trying to catch a falling safe. You’re likely to get crushed by it. It’s a much better idea to wait for the safe to hit bottom and for its contents to explode onto the sidewalk.
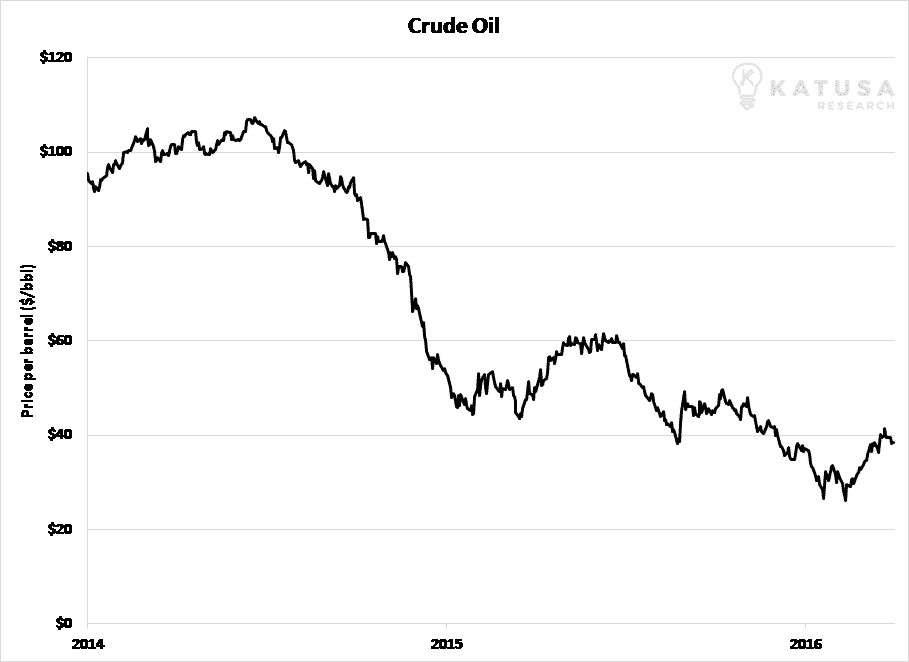
Look at the 2008 crude oil market again. Instead of trying to catch the falling safe by going long when the chart looked like this…
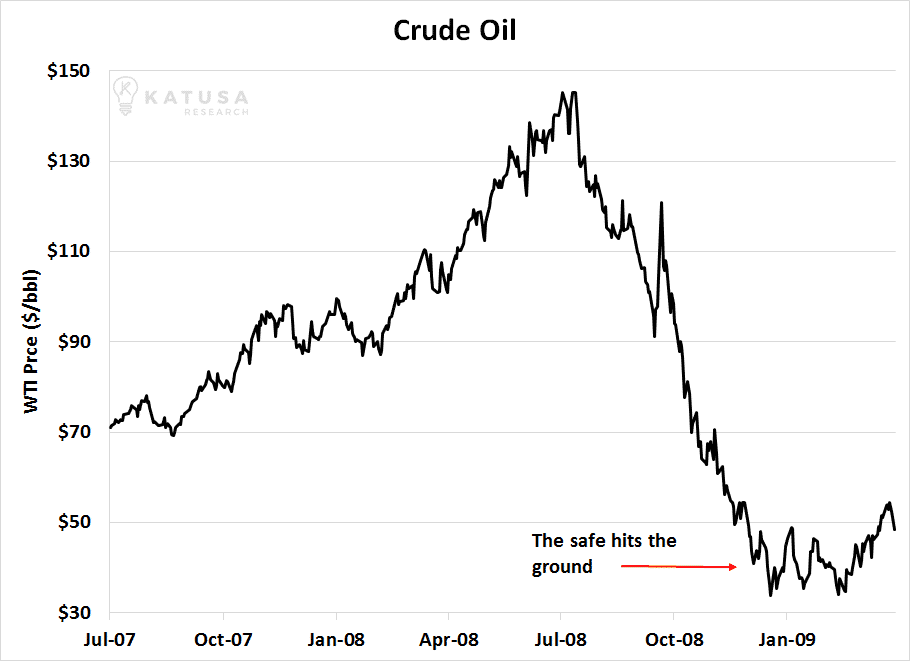
… the smart speculator waits for the safe to hit the ground. He waits for the chart to look like this…
Look at the price action during late 2008. People who bought oil at $70 in October 2008 got a 50% “discount” from July’s high of $140. They also lost half their money as the safe kept falling. It eventually hit the ground at $35 in December.
The safest, best time to buy oil and oil stocks came in early/mid-2009. The falling safe had hit the sidewalk. After hitting a low of $35 a barrel in December, oil rebounded into the upper $40 range. The oil bears countered this rally and tried to drive prices back down to the low several times. Each time, oil refused to decline. Oil “tested” its bottom. There was no one left to sell.
It was much safer to buy oil and oil stocks in early-to-mid 2009 than it was in 2008. People who waited for the safe to hit the ground made huge returns as oil went on to rally into the $70s and $80s in 2009. They waited for the high levels of emotion (and risk) to get wrung out of the market.
This strategy of not buying markets in freefall – and instead, waiting for the falling safe to hit the ground – will put you miles ahead of your fellow investors. It will allow you to consistently make huge returns in the stock and commodity markets.
Keeping our “alligator” approach in mind is crucial right now because I believe we could yet see a crisis in gold companies with development-stage assets. The sector is starting to experience serious stress and serious selling pressure.
Development-Stage Gold Assets Are Getting Very Cheap
If you follow the gold market at all, you know gold stocks performed horribly from 2011 to 2016. It was a bear market that crushed retail and institutional investors alike. Most gold company shareholders felt like they spent years riding on falling safes.
I believe this bear market has made mid-tier gold companies with development-stage projects very cheap. “Development-stage” gold companies have proven assets in the ground and are in the process of building mines. They aren’t drill hole plays and they aren’t yet producing gold.
In addition to suffering from the overall bear market, the gold ETF rebalancing we wrote about
here, gold development firms have performed poorly because of investor fatigue.
Over the last decade, a large majority of the development stage companies have disappointed their investors with cost overruns, production delays, production problems (higher cost of production and lower production levels), and too much debt. Their business performance has been pathetic.
A critical step in getting a gold project into production is something called a Bankable Feasibility Study (BFS). A BFS should be a comprehensive study of a project’s potential economics. It takes into account aspects like geology, metallurgy, infrastructure, and environmental impact. Bankable Feasibility Studies are required for miners to get financing from banks.
In many cases, the Bankable Feasibility Studies (BFS) gold developers touted over the past decade turned out to be nothing more than Bankable-Fiction Stories used to finance the projects that ultimately disappointed shareholders and destroyed shareholder value.
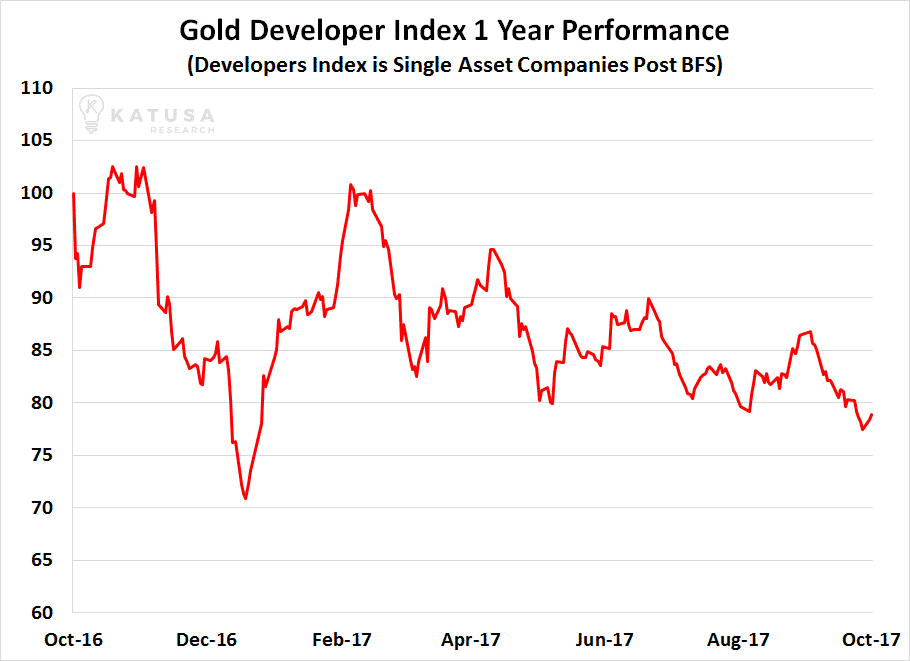
To track this sector, I’ve built a custom stock index, the Katusa Gold Developer Index. It is made up of 15 publicly-listed companies that have completed a BFS on their gold projects and are currently working towards gold production. As you can see from the chart below, this “falling safe” slammed the pavement in late 2016… but has traded in a sideway range since then.
I believe this situation has created some large potential opportunities.
Let me explain.
The management teams who have survived the gold bear market have not forgotten which engineering firms, engineers, and geologists produced the bad Bankable Feasibility Studies. Engineering firms are hired as independent third-party consultants. The engineering firm’s professionals (the geologists, engineers, etc) sign off on the studies. In theory, they should not be “managed or controlled” by the companies that hire them. Also, in every BFS, the individuals who have signed off must publish their professional credentials.
Before I jump into the details of a BFS, I first investigate the track record and credentials of the geologists and engineers who signed off on the BFS. I look at their last dozen studies.
I won’t get into specific names, but there are individuals who have signed off on multiple studies that were absolute disasters. Why bother giving that individual or firm another chance?
Not with my money.
Gold development companies have paid very close attention to these failures as well. Because there are so few mines currently being built, the management teams for the first time in many years can select the best engineering firms using the best geologists and engineers available at reasonable prices, because we are not in a gold bull market. The engineering firms need work and are pitching their best professionals to potential clients. But the market hasn’t figured this out yet. We have.
Another drawback for the development-stage companies is their lack of news flow. There are no sexy drill hole results or near-term catalysts other than completing construction, which in most cases is at least 12 months away.
The combination of previous disappointments from the sector, investor fatigue, lack of news flow, and selling by large gold ETFs has created a sector that is fundamentally cheap and trading at valuations much lower than exploration companies with no 43-101 resource reports, BFS or funding to build mines.
So why should you care?
The larger companies are taking note and paying attention. Consolidation in the mid-tier gold sector is going to happen. The odds of an exploration target ever becoming a mine is lower than 1 in 3,000. Ironically, many of the near-term gold producers are trading today at market capitalizations lower than many exploration companies with nothing more than “potential” and a lot of risk. In some cases, the exploration companies are trading in the $200 million to $1 billion valuation without a single drill hole result!
And with consolidation comes takeouts at premium prices. Once a few takeouts happen, the other gold developers will start trading higher because the market will realize what the new trend in the gold space is, and you will make a fortune.
Why take on the 1 to 3,000 odds, when the companies that have already defeated those odds are trading at valuations lower than their high-risk peers? This is a unique opportunity I’m personally betting big on.
The gold development sector It is the absolute best place in the gold sector for value investors to place their bets.
All the above will happen whether gold prices go higher or not. I believe gold prices are going higher, and that will greatly benefit the gold developers in getting even higher takeout prices.
Safes have been raining in the gold sector. But they’ve hit bottom and are now very cheap. It’s one of the biggest resource opportunities of the next 24 months.
Regards,
Mari
https://katusaresearch.com/single-idea-worth-least-100000/?curator=alphaideas&utm_source=alphaideas